
“Noise Floor” and S/N ratio in and with FFT plots
Introduction
We all know these FFT plots with a noise pattern. I see them all the time in Forums and other websites. The term Noise floor is always close… But is that also the Signal to Noise ratio (S/N ratio)? Or is this the noise voltage output from a voltage regulator for example? NO it is not… Some times I see crazy low values like -160dB and it is called noise floor. Well in some way that might be correct. Sometimes the equipment is at its limit here and cannot measure deeper into the noise. But is might well be a true measurement… but -160dB versus what other value? -160dB is a factor of 100.000.000 (100 Million) so versus 1 Volt this would be 10nV; kind of low…
What is going on and why is this?
I fully admit it also confused the hell out of me for some time. But I believe I got it in the meantime and want to share my thoughts. Now this is NOT unique, there are man articles you can find in the WEB, but most are very scientific and do not go deeper into a simple model for DIY’r to get a quick glance on noise and S/N ration based on a FFT measurement or plots.
Below is a fully random example I find in the WEB somewhere. The web page belonging to this is explaining it also very well by the way. Any way… for the untrained eye or non scientist you could think the S/N ratio of whatever this is, is -140dB? Well it is not. First of all there is a relative dB(r) scale. May be it measures against 100 Volt or 1mV? Who knows? Unlikely but from the plot itself it is not visible.
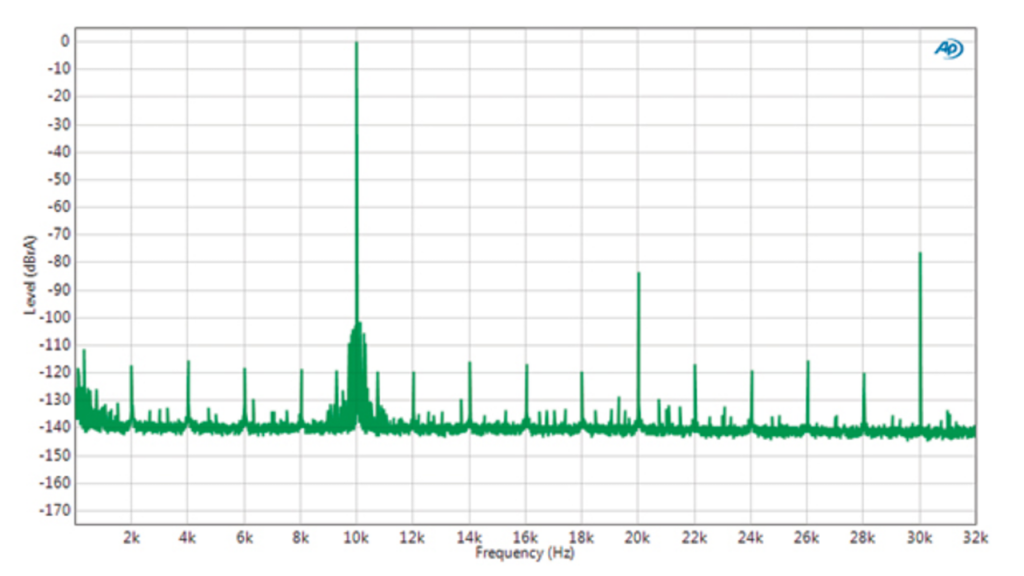
And now comes the real clue: the curve values you see are all kind of small spots calculated by the FFT program. They are called BINs and have a certain width which is depending on the length of the FFT measurement (how many points are you measuring over the audio bandwidth?) and the sample frequency Fs. The narrower/smaller the BIN (= lower sample frequency or longer FFT length) the lower the noise energy in it is, so the dB value will be lower in the plot.
Some sound card PC-FFT applications have very long FFT readings (PC has memory enough…) This leads to very small BINs and hence to very low values and very low dB figures for the “noise Floor” …
BUT… as you can read everywhere, if you want to have the NOISE VOLTAGE, you need to sum up all these bins. This is done by integrating it over the bandwidth. Easier said, just take the kind of “average” value and multiply with the SQRT of the audio bandwidth. An easy to use Bandwidth is 10kHz (I do not hear much above it, so fine for me 😉 ) so multiply with SQRT(10.000) = 100 or just add +40dB…
Confused already? I will give some real world examples:
Measuring and calculating…
I am using my Audio Precision AP-2322 a lot for “Noise” measurements with the FFT function, similar like above picture. It not only shows you any spurs (like 50, 100 Hz residues) but also if the noise is typically more in the low low or high frequencies or flat (like white noise). It creates a holistic view on what you can expect at the output of your amplifier or power supply for example. But we will come back to that later in the article.
Of course AP fully understand the issues with FFT measurements and wrote a good white paper on it. If you want to read this article on FFT noise scaling from Audio Precision first here is the link:
Noise-Scaling-in-FFT-measurement-Audio-Precision-paper.pdf
It is somewhat technical, but describes it very well…
OK, let me explain how it works in less scientific terms
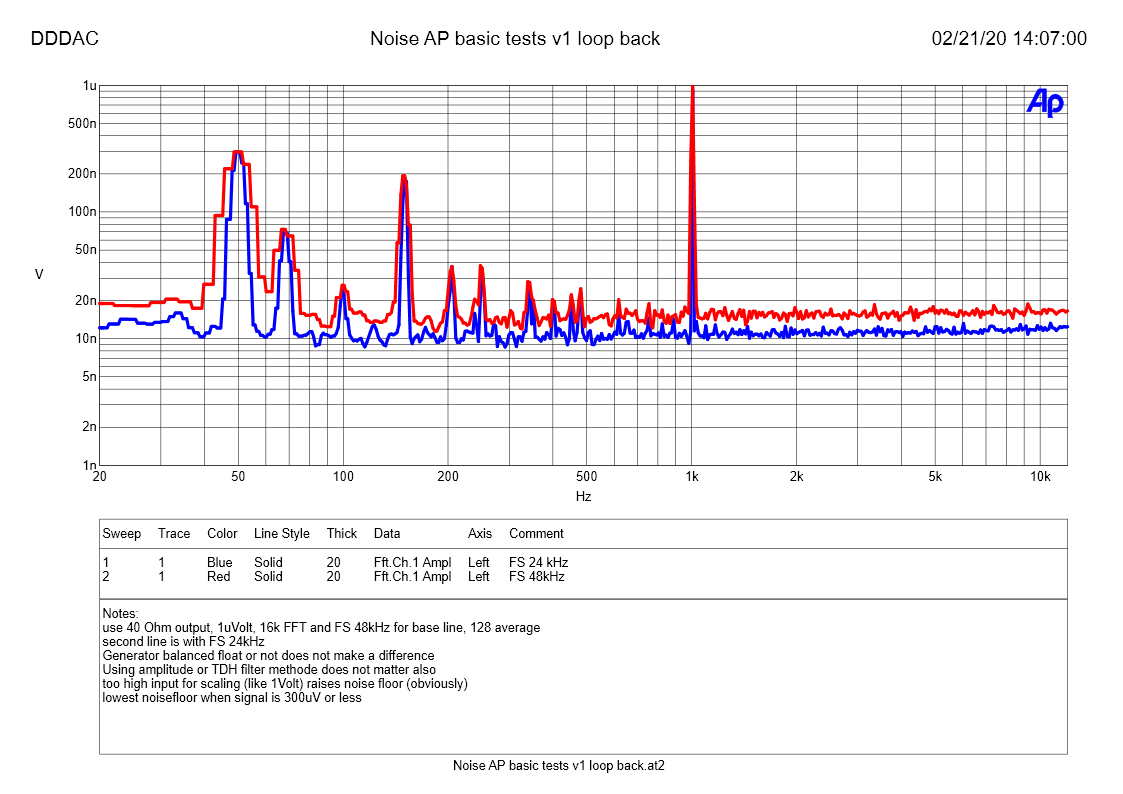
Below is an example what happens if you decrease the sample rate by a factor 2. This was just a loop back on my AP to see how much noise the AP itself has (or generates). NO WAY it would be ~ 15nVolt. But now you understand that right? If we do it the easy way (see conclusion comments) we will end up with roughly 1.5 uV rms (20-10kHz) Forget the spurs, my cabling was not optimal and picked up hum from the table spot transformers. Good example now I think about it: now you see why a FFT is so useful 😉
FFT BINS and BIN width
The BIN width can be calculated by dividing the sample rate by the FFT length; or by dividing the bandwidth by the number of BINs (which is equal to 1/2 the FFT length).
Example
As an example, at a sample rate of 48 kHz and an FFT length of 16,384 (the typical 16K setting), the bandwidth would be DC to 24 kHz, the number of bins would be 8,192 and the BIN width would be 24 kHz / 8,192 which equals 2.93 Hz.
Assuming you read a value (x) with this setting the real V/SQRT(Hz) would be (that value x) / (SQRT (Bin Width)) –
Here: x / 1,71 or the Noise value in dB would -4,6 dB BETTER
With care, you can select sample rates and FFT lengths that will result in a specific bin width; for example, an FFT length of 65,536 samples and a sample rate of 65,536 Hz will provide a bin width of exactly 1 Hz. This is in particular nice as many noise specifications are given at nV/SQRT(Hz) so the curve is already close to an easy reading. Except for multiplying it with the SQRT of the audio bandwidth. Or just add 40dB in the plot as stated earlier in this post.
Let’s do some real word stuff with one of my DDDAC measurements with the AP2322 System Two
DDDAC’s Procedure:
- Select FFT with dBV measurement (so everything is relative to 1 Volt rms)
- Or just select voltage if you want the noise as result in Volt
- A-Weighted (standard in most audio equipment specifications)
- FFT length 16,384
- Fs 32,768 Hz
- Take as many iterations as you have time for a coffee (512 is nice)
This will result in a BIN width of exactly 2 Hz.
The values you “read” from the plot should be corrected with 20 * LOG ( 1 / SQRT (Bin Width))
In this case that result in -3dB. So you have to “subtract” from your plot reading 3dB
DDDAC used Calculations:
- Read the “average” dBV level between 500Hz and 20kHz, assuming this flat – this is most representative for the outcome below the line
- Lower the value with -3dB
- Recalculate this value in Volt by dividing by 20 and take 10 by the power of this number
- Multiply this number with 100. This is the SQRT of the audio bandwidth up to 10kHz (according to the formula at the top)
- Divide this with the full expected output voltage of the amplifier stage at 0dB signal reference level (DAC: 0dBFs – Tape: 0dBU etc.)
- Take the 20 LOG of this number and you have you’re a-weighted S/N Figure
- As a Rule of Thumb, with this special set up of FFT Fs and length and a Noise Curve shaped like this – AND assuming 1 Volt rms output – you can just add +40dB to the “average dB number as described above)
Below is an real world example of my new MU Stage Module (see other post) and I applied exactly what I described above… The steps are just from top to bottom after reading the footnote that the BIN width is 2Hz…
With the FFT measurement of the below image these are the results, using the step 1-7 procedure from above:
- -110dB
- -113dB
- -113 / 20 = -5,65 ……….. now: 10 EXP(-5,65) = 2,24 uVolt
- 2,24 uV x 100 = 0,224 mVolt
Assume that the stage gain = 100 (ECC83) and an input of 5mVolt (like a MM cartridge or tape head) the output will be 500mVolt - 0,224 mV / 500mV = 0,000448
20 * LOG (= 0,000448) = -67dB
This is pretty ok for a low signal tube amplifier – Do NOT forget that the RIAA correction will reduce this figure with another 15-20dB (see below comments as well)

OK, assuming you kind of absorbed all of this? Could it be a bit simpler? Like a rule of thumb or so? YES we can 😉
The simple rule of thumb:
- Assuming the FFT length and Fs sample frequency are kind of the same (which is often – or just make it so !!!) – so no correction factor needed (= no +/- whatever dB)
- Is the line relatively straight? yes? read the dB value or a kind of middle value at the high end of the spectrum as in my example
- Substract -40dB or divide the voltage value by 100 – DONE !!
- Will this be followed by a RIAA, NAB, CCIR or any other low pass filter? Than the energy in the high frequencies will be less. I did some calculations I will not bore you with, but this is the rule of thumb outcome: you can substract ~ -15 to -20dB for the RIAA and tapes equalizations. For a filter with 1kHz -11dB and 5kHz -5dB ….
My summary
- For noise analysis a FFT plot is useless without:
- FFT length
- Fs
- A true reference of what is actually measured
- Flattish curve above 1kHz and FS and FFT length are similar value? Just add +40dB to, or multiply with 100, your reading and you will have your approximate S/N ratio. This one is the most simple one step procedure to use 🙂
That’s all folks *)
I created a poll at DIY.com if this useful stuff and written understandable, also for non – engineers –
it would be nice if you give your vote link to poll on DIY.com
*) This phrase was first used at the end of a 1930 Warner Bros. Looney Tunes cartoon and was spoken by the character Bosko. 🙂
2 thoughts on ““Noise Floor” and S/N ratio in and with FFT plots”
with no output arguments plots the spectrum of the signal in the current figure window and labels its main features. It uses different colors to draw the fundamental component, the DC value and the harmonics, and the noise. The SNR appears above the plot. This functionality works for all syntaxes listed above except Embed the pulse in white Gaussian noise such that the signal-to-noise ratio (SNR) is 53 dB. Reset the random number generator for reproducible results.
Hello,
No interesting comment, just thank you, very helpfull.